本文概览:介绍了折线图(阴影、网格、缩放等功能)、饼图、关系图的使用。
一、折线图
1.1 使用
参考http://echarts.baidu.com/examples/editor.html?c=line-marker 。新增了阴影、缩放、x轴网格、线条颜色的功能。

包含两部分:
(1)html
|
1 |
<div id="containerZheXian" style="margin-top:20px;height:400px"></div> |
(2)javascript
|
1 2 3 4 5 6 7 8 9 10 11 12 13 14 15 16 17 18 19 20 21 22 23 24 25 26 27 28 29 30 31 32 33 34 35 36 37 38 39 40 41 42 43 44 45 46 47 48 49 50 51 52 53 54 55 56 57 58 59 60 61 62 63 64 65 66 67 68 69 70 71 72 73 74 75 76 77 78 79 80 81 82 83 84 85 86 87 88 89 90 91 92 93 94 95 96 97 98 99 |
<script type="text/javascript"> var dom = document.getElementById("containerZheXian"); var myChart = echarts.init(dom); var app = {}; var xValues = new Array(); var yValues = new Array(); #set($index = 0) #foreach( $vo in $VoList) xValues[$index] = '$vo.getTime()'; yValues[$index] = $vo.getValue(); #set($index = $index + 1); #end option = null; option = { color: ['#7EB26D'], // 线条颜色 tooltip: { trigger: 'axis' }, title: { text: '未来一周气温变化', subtext: '纯属虚构', x: 'center' }, legend: { data: ['温度'], x: 'left', orient: 'vertical', }, toolbox: { show: true, feature: { dataZoom: { yAxisIndex: 'none' }, dataView: {readOnly: false}, magicType: {type: ['line', 'bar']}, restore: {}, saveAsImage: {} } }, xAxis: { type: 'category', boundaryGap: false, splitLine: { show: true, }, // 用于显示x轴网格线 data: xValues }, yAxis: { type: 'value', }, dataZoom: [ { show: true, start: 0, end: 100, handleSize: 8 }, { type: 'slider', start: 0, end: 100 }, ], // 用于显示缩放功能 series: [ { name: '温度', type: 'line', data: yValues, symbolSize:0, itemStyle: {normal: {areaStyle: {opacity:0.05}}}, // 用于显示阴影 markPoint: { data: [ {type: 'max', name: '最大值'}, {type: 'min', name: '最小值'} ] }, markLine: { data: [ {type: 'average', name: '平均值'} ] } } ] }; if (option && typeof option === "object") { myChart.setOption(option, true); } </script> |
1.2 常见功能
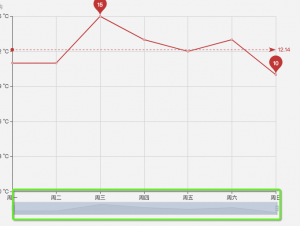
1、缩放功能
在option中添加
|
1 2 3 4 5 6 7 8 9 10 11 12 13 14 15 16 17 |
option={ .... dataZoom: [ { show: true, start:0, end: 100, handleSize: 8 }, { type: 'slider', start: 0, end: 100 }, ], .... } |
效果如下图
2、网格线
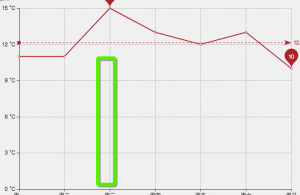
默认Y轴是有线的,但是X轴没有,通过如下属性来设置X周的网格线
|
1 2 3 |
splitLine: { show: true, } |
举例如下:
|
1 2 3 4 5 6 7 8 |
xAxis: { type: 'category', boundaryGap: false, data: xValues, splitLine: {//终于找到了,背景图的内置表格中“边框”的颜色线条 这个是x跟y轴轴的线 show: true, } }, |
3、阴影
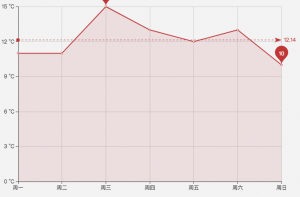
itemStyle: {normal: {areaStyle: {opacity:0.01}}},
其中,
- opacity表示透明度。0-1取值。
- 默认是线条颜色,但是可以使用shadowColor: ‘rgba(0, 0, 0, 0.5)’指定背景颜色,如下
itemStyle: {normal: {areaStyle: {shadowColor: ‘rgba(0, 0, 0, 0.5)’,opacity:0.08}}},
举例如下:
|
1 2 3 4 5 6 7 8 9 10 11 12 13 14 15 16 17 18 19 |
series: [ { name: 'Count', type: 'line', itemStyle: {normal: {areaStyle: {shadowColor: 'rgba(0, 0, 0, 0.5)',opacity:0.08}}}, data: yValues, markPoint: { data: [ {type: 'max', name: '最大值'}, {type: 'min', name: '最小值'} ] }, markLine: { data: [ {type: 'average', name: '平均值'} ] } } ] |
4、设置线条颜色
在series中进行如设置
|
1 2 3 4 5 6 |
itemStyle: { normal: { areaStyle: {opacity:0.05}, lineStyle: {color: ['#3398DB']} } }, |
5、去掉折线中小圆圈⭕️

通过设置symbolSize:0,举例如下:
|
1 2 3 4 5 6 7 8 9 |
series: [ { name: 'Count', type: 'line', data: yValues, symbolSize:0, ... } ] |
6、设置legend的颜色
|
1 2 3 4 5 |
color:['#3398DB','#2f4554'], legend: { data: ['$currentDate', '$relationDate'], x: 'left' }, |
7、最大点markPonit的颜色。通过itemSytle#color设置
|
1 2 3 4 5 6 7 8 9 |
markPoint: { data: [ {type: 'max', name: '最大值'}, {type: 'min', name: '最小值'} ], itemStyle:{ color: ['#2f4554'] } }, |
8、平均线markLine的颜色。通过itemSytle#color设置
|
1 2 3 4 5 6 7 8 |
markLine: { data: [ {type: 'average', name: '平均值'} ], itemStyle:{ color: ['#2f4554'] } } |
9、自定义marLine。通过markLine.data指定。
当我们在计算平均值时,需要剔除为0的值,或者我们自定义平均值算法时,此时可以自己设置平均线
|
1 2 3 4 5 6 7 8 9 10 11 12 |
series: [{ data: [820, 932, 901, 934, 1290, 1330, 1320], type: 'line', markLine : { data : [ [ {xAxis:'Mon', yAxis: 900}, {xAxis: 'Sun', yAxis: 900,value=900} ] ] } }] |
10、tooltip
相关属性参考:
https://echarts.baidu.com/option.html#tooltip.formatter
二、饼图
2.1 使用
参考:http://echarts.baidu.com/examples/editor.html?c=pie-simple 。效果如下
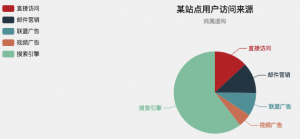
包含两部分
(1)html
|
1 |
<div id="containerBingTu" style="margin-top:20px;height: 100%;height:460px"></div> |
(2)javascript
|
1 2 3 4 5 6 7 8 9 10 11 12 13 14 15 16 17 18 19 20 21 22 23 24 25 26 27 28 29 30 31 32 33 34 35 36 37 38 39 40 41 42 43 44 45 46 47 48 49 50 51 52 53 54 55 56 57 58 59 60 61 62 63 |
<script type="text/javascript"> var dom = document.getElementById("containerBingTu"); var myChart = echarts.init(dom); var app = {}; var xValues = new Array(); var staticVo = new Array(); #set($index = 0) #foreach( $vo in $voList) // 后端的VO xValues[$index]='$vo.getName()'; // 左侧的每个维度说明 var s = new Object(); // 饼图需要的数据 s.value = $vo.getValue(); s.name = '$vo.getName()'; staticVo[$index]=s; #set($index = $index + 1); #end option = null; option = { title : { text: '某站点用户访问来源', subtext: '纯属虚构', x:'center' }, tooltip: { trigger: 'item', formatter: "{a} <br/>{b} : {c} ({d}%)" }, toolbox: { // 右上角的工具栏 show : true, feature : { dataView : {show: true, readOnly: false}, magicType : {show: true, type: ['line', 'bar']}, restore : {show: true}, saveAsImage : {show: true} } }, legend: { orient: 'vertical', left: 'left', data: xValues }, series: [ { name: 'Count', type: 'pie', radius: '55%', center: ['50%', '60%'], data: staticVo, itemStyle: { emphasis: { shadowBlur: 10, shadowOffsetX: 0, shadowColor: 'rgba(0, 0, 0, 0.5)' } } } ] }; ; if (option && typeof option === "object") { myChart.setOption(option, true); } </script> |
2.2 常用功能
1、分页 标签栏
效果如下下图
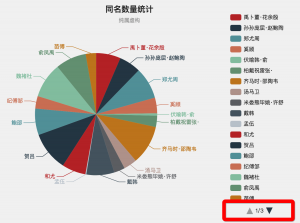
通过“scroll”设置type,如下
|
1 2 3 4 5 6 7 8 |
legend: { type: 'scroll', orient: 'vertical', // 竖直列出各个值 left: 0, //位于左侧 top: 20, //距离顶部举例 bottom: 20, //距离底部举例 data: xValues }, |
2、重叠
避免如下图中文字重叠,进行设置
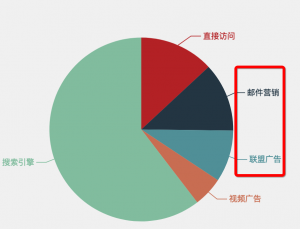
可以设置“avoidLabelOverlap: true,”,在series设置如下:
|
1 2 3 4 5 6 7 8 9 10 |
series : [ { name: '访问来源', type: 'pie', radius : '60%', avoidLabelOverlap: true, .... } ] |
3、设置最小扇区
在某些情况下,有些区域特别小,无法再图中体现出来,此时我们需要通过minAngle属性设置扇形区域展现的最小值
|
1 2 3 4 5 6 7 8 9 10 |
series : [ { name: '访问来源', type: 'pie', radius : '60%', minAngle:1, .... } ] |
4、存放饼图的div的高度自适应
当数据过多时,饼图中标签没有办法在div中显示全,如下
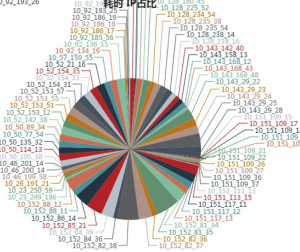
此时需要动态的扩展div的高度,来让饼图中所有信息全部显示出来,这里在原来的script中进行修改,插入如下代码,没有数据div高度为30px,数据量不超过60个,则为460px,否则按照规则进行增长div高度。
|
1 2 3 4 5 6 7 8 9 10 11 12 13 14 15 16 17 18 19 20 21 22 23 24 25 26 |
<script type="text/javascript"> var dom = document.getElementById("container"); ######### 自适应 开始 ####### #if($ipVoList.size()==0) dom.style.height = 30 + 'px'; #elseif($ipVoList.size() > 60 ) #set($pinHeight=$ipVoList.size() / 10 * 100 - 100) #if($pinHeight>800) #set($pinHeight=800) #end dom.style.height = $pinHeight + 'px'; #else dom.style.height = 30 + 'px'; #end ######### 自适应 结束 ####### var myChart = echarts.init(dom); 。。。。。。 </script> |
5、不显示饼图中为0的信息
如下图,只有一个有值,其他没有值
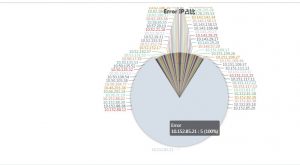
为了把上图中为0的数据过滤掉,在<script>中修改如下
|
1 2 3 4 5 6 7 8 9 10 11 12 13 14 15 16 17 18 19 20 21 22 |
<script> var dom = document.getElementById("container"); .......... // 过滤掉为0的数据 #set($index = 0) #foreach( $vo in $errorIpVoList) #if($vo.getErrorCount() ==0) #else xValues[$index] = '$vo.getGroupTag()'; var s = new Object(); s.value = $vo.getErrorCount(); s.name = '$vo.getGroupTag()'; staticVo[$index] = s; #end #set($index = $index + 1); #end ..... </script> |
三、关系图
1、节点形状symbol和symbolSize
http://echarts.baidu.com/option.html#series-graph.data
包含五种形状如下:
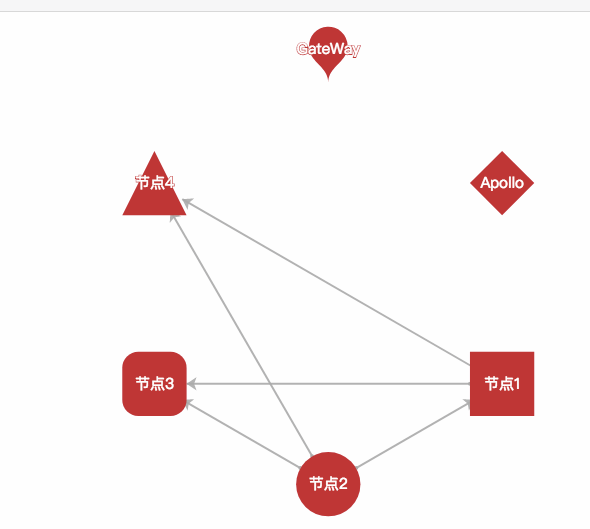
如下是正方形
|
1 |
symbol:'rect', |
还可以通过x和y指定大小,此时就是矩形了
|
1 |
symbolSize:[68,40], |
2、布局layout
参考:http://echarts.baidu.com/option.html#series-graph.layout
layout可以选择none、circular和force
- ‘none’ 不采用任何布局,使用节点中提供的 x, y 作为节点的位置。
- ‘circular’ 采用环形布局。
- ‘force’ 采用力引导布局。
3、标记节点颜色
|
1 2 3 4 5 |
itemStyle: { normal: { color: '#4b565b' } } |
四、添加事件
1、事件说明
echarts的时间,都可以通过如下代码来添加
|
1 2 3 |
myChart.on('click', function (params) { }); |
目前支持事件的有’series’(直方图)、’markLine’(平均线)、’markPoint’(最大最小值等)、’timeLine’ 等。因为所有这些类型都走一个公用的代码,所以需要区分,即在一个这些图中有最大值、最小值和平均线,都会走同一个事件逻辑,可以通过如下区分:
|
1 2 3 4 5 6 7 8 9 10 11 12 13 14 15 16 17 18 |
myChart.on('click', function (params) { if (params.componentType === 'markPoint') { // 点击到了 markPoint 上 if (params.seriesIndex === 5) { // 点击到了 index 为 5 的 series 的 markPoint 上。 } } else if (params.componentType === 'series') { if (params.seriesType === 'graph') { if (params.dataType === 'edge') { // 点击到了 graph 的 edge(边)上。 } else { // 点击到了 graph 的 node(节点)上。 } } } }); |
2、直方图
在直方图的柱子上点击,就会跳转页面。如下区域

|
1 2 3 4 5 6 7 8 9 10 11 |
<script type="text/javascript"> var dom = document.getElementById("container"); ...... var myChart = echarts.init(dom); // 添加点击事件 myChart.on('click', function (params) { window.open('/apiTrend?api=' + encodeURIComponent(params.name)); }); </script> |
3、折线图的最大值或者最小值上添加点击事件,可以通过超链接调到其他页面,如下图区域

对于markPoint类型的事件,无法获取到X坐标,只能获取Y值和“最大值/最小值”的标识两个信息,为了获取X坐标信息,如下代码
|
1 2 3 4 5 6 7 8 9 10 11 12 13 14 15 16 17 18 19 20 21 22 23 24 25 26 27 28 29 30 31 32 33 34 35 36 37 38 39 40 41 42 43 44 45 46 47 48 49 50 51 52 53 54 55 |
<script type="text/javascript"> var dom = document.getElementById("container"); ...... markPoint: { data: [ {type: 'max', name: '最大值'}, {type: 'min', name: '最小值'} ] }, ...... var myChart = echarts.init(dom); // 添加点击事件 myChart.on('click', function (params) { // 1.初始化X和Y的值 var timeValues = new Array(); var countValues = new Array(); #set($index = 0) #foreach( $vo in $voList) timeValues[$index] = '$vo.getTime()'; countValues[$index] = $vo.getCount(); #set($index = $index + 1); #end // 2.预处理:获取最大值或者最下值的坐标 var maxValue = 0; var maxIndex = ''; var minValue = 999999; var minIndex = ''; for(var i=0;i<countValues.length;i++){ if(maxValue < countValues[i]){ maxValue = countValues[i]; maxIndex = timeValues[i]; } if(minValue < countValues[i]){ minValue = countValues[i]; minIndex = timeValues[i]; } } // 3.根据最大值或者最小值查询问题 var timeStr = ''; if (params.name == '最大值') { timeStr = maxIndex; } else { timeStr = minIndex; } window.open('/queryApi?api=$api' + '&time=' + encodeURIComponent(timeStr) ); }); </script> |
五、Tree
5.1 使用
http://echarts.baidu.com/examples/editor.html?c=tree-legend
|
1 2 3 4 5 6 7 8 9 10 11 12 13 14 15 16 17 18 19 20 21 22 23 24 25 26 27 28 29 30 31 32 33 34 35 36 37 38 39 40 41 42 43 44 45 46 47 48 49 50 51 52 53 54 55 56 57 58 59 60 61 62 63 64 65 66 67 68 69 70 71 72 73 74 75 76 77 78 79 80 81 82 83 84 85 86 87 88 |
var data1 = { "name": "appName", "children": [{ "name": "bj", "children": [{ "name": "tc", "children": [{ "name": "123.4.5.7:8771", "value": 0 }, { "name": "123.4.5.7:8771", "value": 0 } ] }, { "name": "bb", "value": 0 } ] }, { "name": "hn", "children": [{ "name": "kk", "children": [{ "name": "123.4.5.7:8771", "value": 0 }, { "name": "123.4.5.7:8771", "value": 0 } ] } ] } ] }; myChart.setOption(option = { tooltip: { trigger: 'item', triggerOn: 'mousemove' }, series: [{ type: 'tree', name: '集群分布', data: [data1], top: '1%', left: '7%', bottom: '1%', right: '20%', symbolSize: 9, label: { normal: { position: 'left', verticalAlign: 'middle', align: 'right', fontSize: 12 } }, leaves: { label: { normal: { position: 'right', verticalAlign: 'middle', align: 'left', fontSize: 12 } } }, expandAndCollapse: true, animationDuration: 550, animationDurationUpdate: 750 }] }); |
展示效果如下:
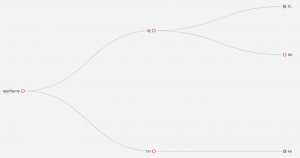
此时需要后端代码中定义一个Tree,就可以了如下
|
1 2 3 4 5 6 7 8 9 10 11 12 13 14 15 16 17 18 19 20 21 22 |
public class ClusterNode { String name; List<ClusterNode> children = Lists.newArrayList(); // 其他属性 public String getName() { return name; } public void setName(String name) { this.name = name; } public List<ClusterNode> getChildren() { return children; } public void setChildren(List<ClusterNode> children) { this.children = children; } } |
只需要返回该tree的json字符串就可以了
|
1 2 3 4 |
// 生成tree ClusterNode tree =.... // 转成json JSONObject.toJSONString(tree) |
5.2 常用功能
1、 默认展开所有节点,通过series[i]-tree.initialTreeDepth属性设置默认展开级别
|
1 |
initialTreeDepth:3, |
参考文献
1、官网 http://echarts.baidu.com/examples/


